
Our take: key differences between the Ceph and JBOF/NVMe storage systems
Recently, we’ve shared our long, hands-on journey to find the most effective and balanced storage solution for our custom-built web hosting platform.
We went into detail about the specific hardware JBOF/NVMe configuration that makes the perfect formula for a lightning-fast storage performance across our system.
Today, we will share our insight into the key differences between this custom JBOF/NVMe setup and the common Ceph storage solution.
This will give you a better understanding of why we went for a custom storage solution and will help you market its positives to your customers in an informative way.
JBOF vs Ceph: reliability comparison
One of the significant differences between the JBOF setup and the Ceph storage system lies in the level of reliability.
While losing all data copies is relatively rare, it’s still something to be aware of as a possibility and something that you have to plan for your disaster recovery plans.
However, what we encountered with alarming frequency were numerous bugs. While Ceph itself is a mature platform, there are still bugs around, some of which can block data from being accessed or affect the speed of the cluster so much that it effectively grinds itself to a halt.
Bugs in Ceph are not very well documented even though customers frequently run into them, which leads to additional time to recover from a bug, as you first have to spend a significant amount of time to identify the cause of the problem.
In our usage of Ceph, we ran into some bug every 2 or 3 months. In comparison, we’ve been using a JBOF solution for over a year and are yet to encounter any serious issue.
We’ll illustrate this with an example from our hands-on experience with Ceph.
Let’s say that you have 300 TB of data at hand.
If you happen to lose your final copy of data, you will have to spend at least a few hours trying to fix the issue, then another couple of hours doing a clean setup using the same hardware and copying data from the backup to the Ceph cluster.
This process will take you anywhere from 12-24 hours until you start copying your data back.
The data transfer at best will go at the speed of 1 GB/s (but most likely 300-500 MB/s on SATA SSD), which is about 3.6 TB per hour.
So for 300 TB of data, as in our example, you will need about 83 more hours to restore all the data (at the speed of 1 GB/s).
To sum up, the total downtime for many of the services could be anywhere between 95 hours and 120-150 hours for 300 TB of data.
Such events are business killers. If your main business is relying on 24/7/365 reliability, then you may have already lost most of your customers and your whole business as well.
Here is an example of this situation:
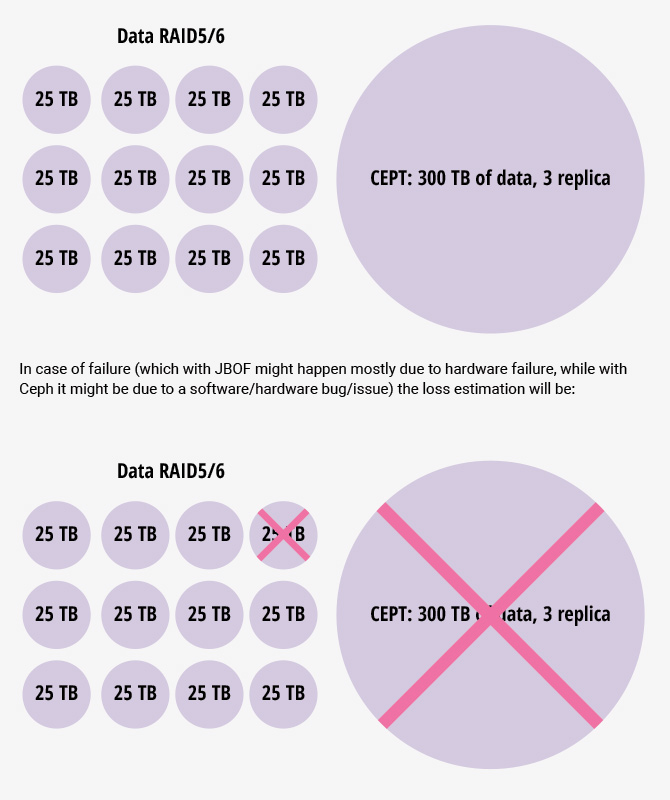
With this setup, you risk losing the data located on the HV that’s left without any copy.
With the JBOF setup, if you spread the drives equally across all HV’s, and you use 3.84 TB of NVMe storage (that makes approximately 13.8 TB per HV), that’s all you risk in the worst-case scenario.
It will take anywhere from 14-20 hours for these 14 TB’s of data to be restored.
So, in the worst-case scenario, you will have less downtime compared to Ceph or other distributed storage.
Another advantage of the JBOF setup is the ability to use snapshots of the VM’s.
You can use ZFS to take advantage of its great snapshot system. This will give you an exact copy of the data on your backup server with no negative effect on performance.
NVMe drives are operating so fast that performing such backups will be virtually intangible to users.
You have to perform more than 15,000 IOPS per TB to hit the limit of the system and to experience latency due to the backups.
In the 14 TB example above, it would mean you have a total capacity of 220,000 IOPS.
Surely, some companies can do that much but, overall, most of the companies will be far below the afore-mentioned amount of IOPS for 14 TB of data.
JBOF vs JBOD: flexibility comparison
As you see, this is a real JBOF solution that is more flexible than any JBOD setup.
JBODs support more limited connections to servers/hosts and lack the software needed to control which drive on which server is visible.
With JBOD, there is no in-the-middle situation, it is either all drives are visible on one server or none are.
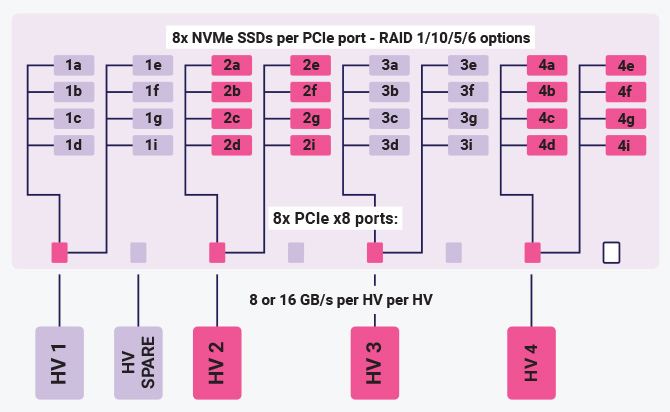
Our custom JBOF setup, in contrast to JBOD, has the following zoning options via IPMI and CLI:
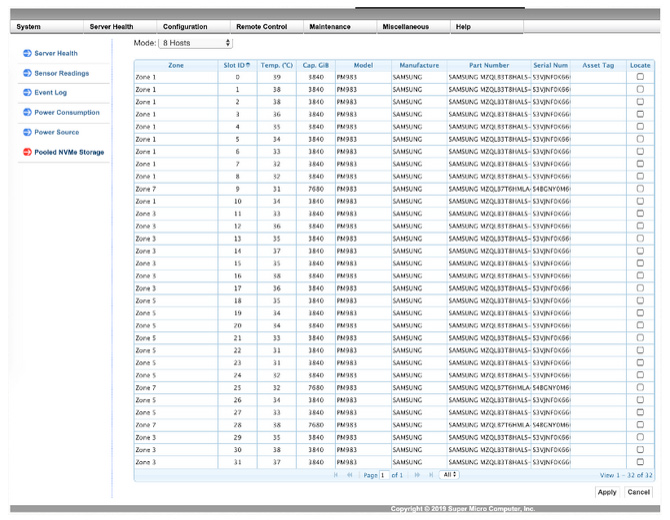
You can select any SSD and point it to another ZONE, making it instantly accessible to the new ZONE. Cool, isn’t it?
JBOF cluster power usage
Let’s take a look at the power usage characteristics of the JBOF setup:
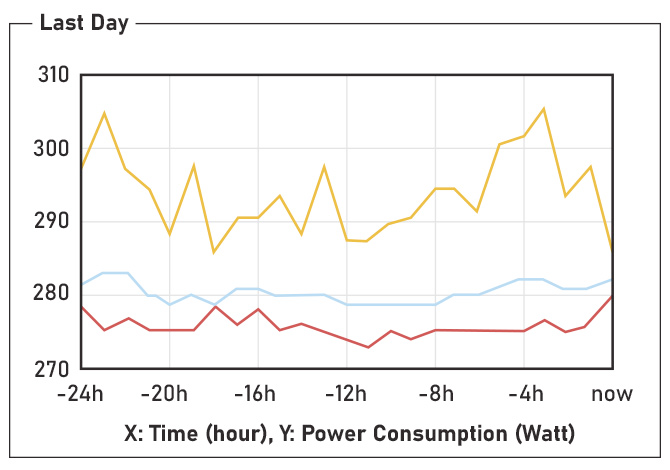
Blue is average WATTs
Red is minimum WATTs
This particular JBOF is fully populated and under load averages of around 280 WATTs. It should be noted that this JBOF is passive, i.e. it has no CPUs or RAM.
A similar JBOF solution with CPUs/RAM could double this number on average, depending on the CPU load.
A JBOF solution with added CPUs / RAM could double this number on average, depending on the CPU load.
In addition, a JBOF solution with CPUs / RAM will also generate more heat, which can cause issues in crowded racks. The added heat can also lead to stability issues and shorten the lifespan of the whole system.
This is how the HyperVisor sees the drives in this case:
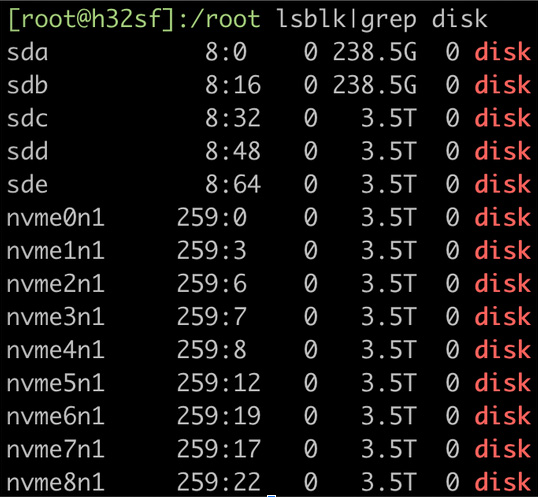
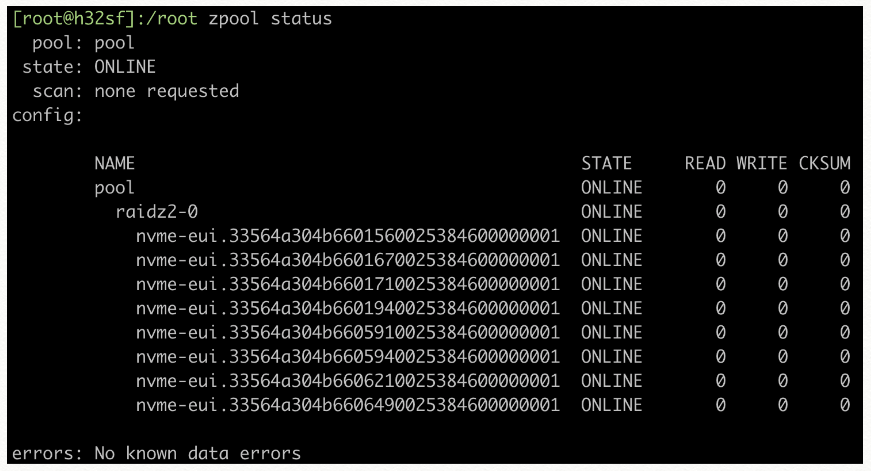
As you can see, they look like normal NVMe drives. smartctl and all other goodies run as smoothly as on a local drive.
And here is how the lspci command will look like:
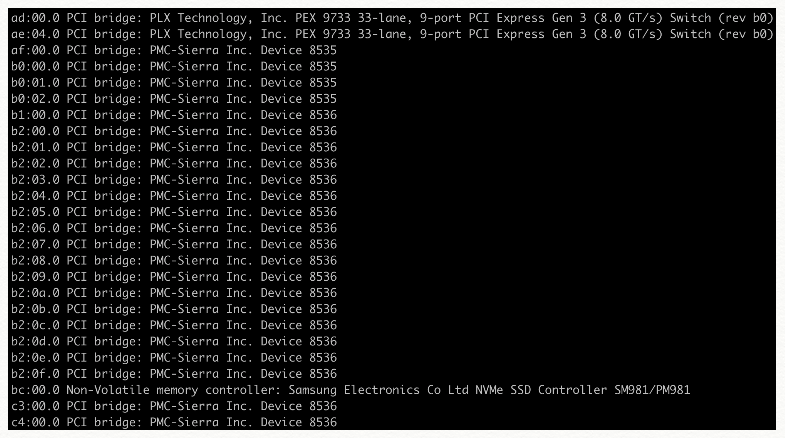
Note: PEX 9733 is the AOC PCI-e card.
JBOF vs Ceph: Cost per TB comparison
Here’s an example of what amount of storage you get per storage cluster:
Redundant storage – Option 1:
2 JBOFs [cost $9,000]
8 HyperVisors (one is a spare) [cost $9,000]
62 NVMe (four NVMe are spares) [costs depend on the size]
PCIe cables and AOC [cost $2,600]
With 1.9TB NVMe SSD, you will get: ~48TB total, 6.8TB per HV, RAID 1, total cost $41,680, $868 per TB, $5,954 per HV.
With 3.84TB NVMe SSD you will get: ~96.7TB total, 13.8TB per HV, RAID 1, total cost $57,180, $591 per TB, $8,168 per HV.
With 7.68TB NVMe SSD you will get: ~193.2TB total, 27.6TB per HV, RAID 1, total cost $95,000, $491 per TB, $13,571 per HV.
The formula to calculate the available/usable space is:
(SSD size – 10% * (number SSDs – 4)) / 2
All SDS’s have their pricing based on RAW TB storage.
Let’s see how expensive this solution is using RAW TB:
58 NVMe x 1.9TB = 110TB ($41,680/110 = $378 per RAW TB)
58 NVMe x 3.84TB = 222TB ($57,180/222 = $257 per RAW TB)
58 NVMe x 7.68TB = 445TB ($95,000/445 = $213 per RAW TB)
Performance-wise, you can expect quite a lot with 60% read and 40% write, about 150,000 IOPS (8kb random) per RAID1 pair with ZFS.
With 28 RAID1 pairs, the total IOPS available will be about 4.2 million (that’s a better number compared to the 30-90k IOPS on Ceph).
An alternative option is to start using iSCSI and provide the storage for more HyperVisors.
However, your storage will be dependent on one more layer this way. This will make the network setup more complex and may lead to more failure cases.
The main idea behind this JBOF setup is to be simple, easy to manage, effective, high-performance, and cost-effective.
Obviously, this is not a setup for small businesses or individuals (although it does depend on the scale and budget).
For example, the minimum setup cost is:
2 JBOF’s – $9,000
2+ HyperVisors barebone – $3,000
16 1.9TB NVMe SSD – $5,440
Total: $17,440 and then you can continue adding drives and hypervisors until you max it out.
Now, let’s calculate the hardware required for a similar amount of space on Ceph.
Ceph numbers for 95 TB of usable storage are as follows:
3x SuperMicro 2029U-TN24R4T – $11,400
6x High frequency Intel Xeon CPUs 6244- $17,550
768 GB RAM – $4,000
42x 7.68 TB NVMe – $50,000
Total costs: $82,950 with replica 3 for 96.6 TB, or about $858 per usable TB.
This price does not incur the costs required for hiring a well-trained staff.
Performance-wise, this setup will have bigger latency than the JBOF solution.
Pricing per RAW TB:
42 NVMe x 7.68TB = 322TB ($82,950/322 = $257 per RAW TB)
As you can see, Ceph doesn’t look expensive in terms of RAW TBs, but once you calculate the real space you will be able to use, the price goes up three times due to replica 3.
There is an option to use a budget model, consisting of 1x JBOF, one or more HV’s, and 8x NVMe’s of any size. Overall, the JBOF is built to be almost fully redundant.
So, you can connect up to four HV to a single JBOF with dual links and have exceptionally good redundancy as well.
However, in the event of a problem with the single JBOF you use, you will be faced with downtime issues.
The likelihood of a JBOF problem is low, but it still exists. Overall, JBOFs have better redundancy than JBODs.
The single most vulnerable item in the JBOF that’s is not redundant is the NVMe backplane in each of the sleds.
However, it is a passive element and the possibility for a failure of the backplane is incredibly low.
Everything else inside is redundant and with the proper setup you can achieve 99.99% uptime without issues.
Such a budget setup starts at about $10,700 for 2x HV’s, 1x JBOF, 8x 1.9 TB NVMe’s.
Let’s see how much a fully populated cluster costs:
1x SuperMicro TwinPro servers 2029TP-HTR barebone = $4,500 (4x active HV)
1x SuperMicro 1029P-WTR = $1,400 (for spare server)
1x SuperMicro JBOF = $4,500
32x 3.84TB NVMe PM983 SSD = $18,880
5x AOC-SLG3-4X4P = $1,250
PCIe cables = $400
Total costs: $30,930 (without CPUs and RAM, which can greatly vary from an option to option)
Available storage in RAID 1/RAID 10: ~54.4 TB (13.6 TB per HV, $568 per usable TB, $7,732 per HV)
Available storage in RAID 5: ~95.2 TB (23.8 TB per HV, $324 per usable TB, $7,732 per HV)
Available storage in RAID 6: ~81.6 TB (20.4 TB per HV, $379 per usable TB, $7,732 per HV)
Pricing per RAW TB:
32 NVMe x 3.84TB = 122TB ($30,930/122 = $253 per RAW TB)
This setup is the one that offers the smallest cost difference between RAW TB and USABLE TB. It goes as low as $253 per RAW TB vs $324 per usable TB, a difference of just 71 USD!
In such setups, if your project is not too hungry for IOPS and 100,000 IOPS (8k random 60%/40% read/write) are sufficient, RAID 6 is the recommended option.
The minimum setup for this case would be:
2x SuperMicro 1029P-WTR (one active, one spare) = $2,800
1x SuperMicro JBOF = $4,500
8x 1.9TB NVMe PM983 SSD = $2,720
2x AOC-SLG3-4X4P = $500
PCIe cables = $160
Total cost: $10,680 (without CPUs and RAM, which can vastly vary from option to option)
These are just exemplary configurations, the real-life scenarios are numerous.
JBOF vs Ceph: IOWAIT comparison
Now, let’s show you the results. This is a screenshot of a VM running on the JBOF solution in RAID 6:
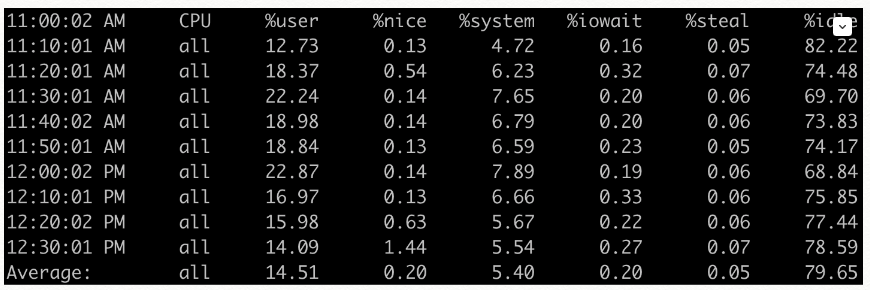
As you can see, the %iowait, the time the CPU’s are waiting for the storage, is nearly 0%.
Now, let’s take a look at a similar case whereby a server is running similar services and load using the Ceph SSD solution, replica 3:
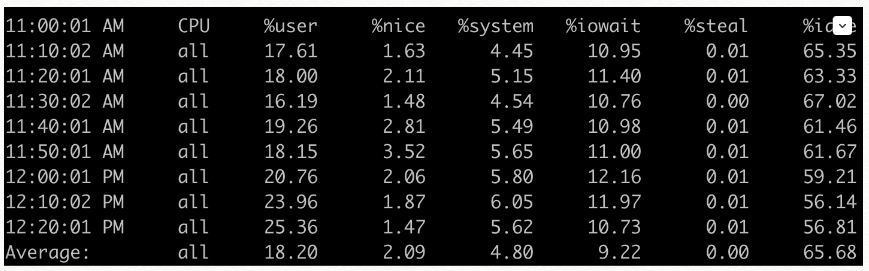
The Ceph solution has %iowait around 10% and it goes up when the backup starts, reaching 18%-25%. It stays there for more than 24 hours.
The JBOF solution is also impacted when the backup is running, but we have not seen the %iowait go above 3% at any given time, and overall it is around 1%-1.5%.
The JBOF setup does not only give you fast storage performance, but it also gives you 10%-20% more CPU power since the CPUs are tied up waiting for the storage.
This way, you can take advantage of all your CPU capacity instead of having it sit and wait, as is the case with the mainstream setups mentioned above.
Here’s an IOPING test as well, with a Ceph solution running inside the VM:
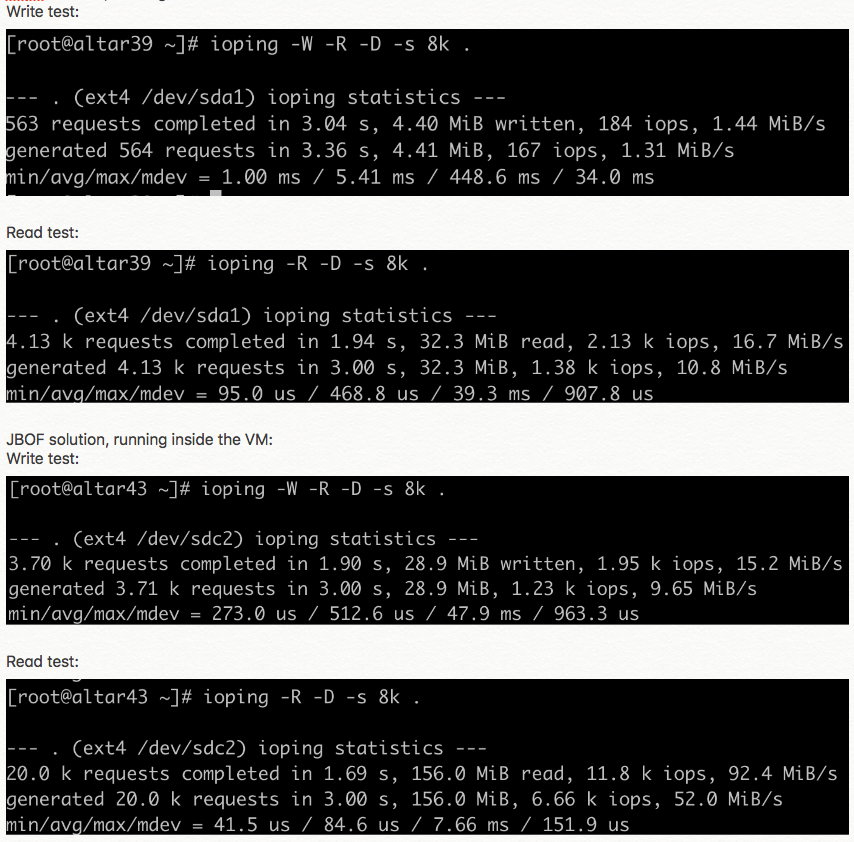
The most important performance factor here is the latency.
Ceph’s average write latency is 5400 us, while the average write latency with JBOF is 512 us.
That’s a ten times difference. The average read latency is 468 us vs 84 us, a 5.5x difference.
The Ceph on which this VM is running is not overloaded and it is running at around 50% of its capabilities.
But as soon as it reaches 70-80% of the maximum performance it is capable of, the latency spikes a lot more and becomes a bottleneck for all HyperVisors using the storage.
Here are PIDSTAT kb/s read/write, IOSTAT, and ZPOOL IOSTAT detailed results of the NVMe drives on one of our servers using the JBOF solution:
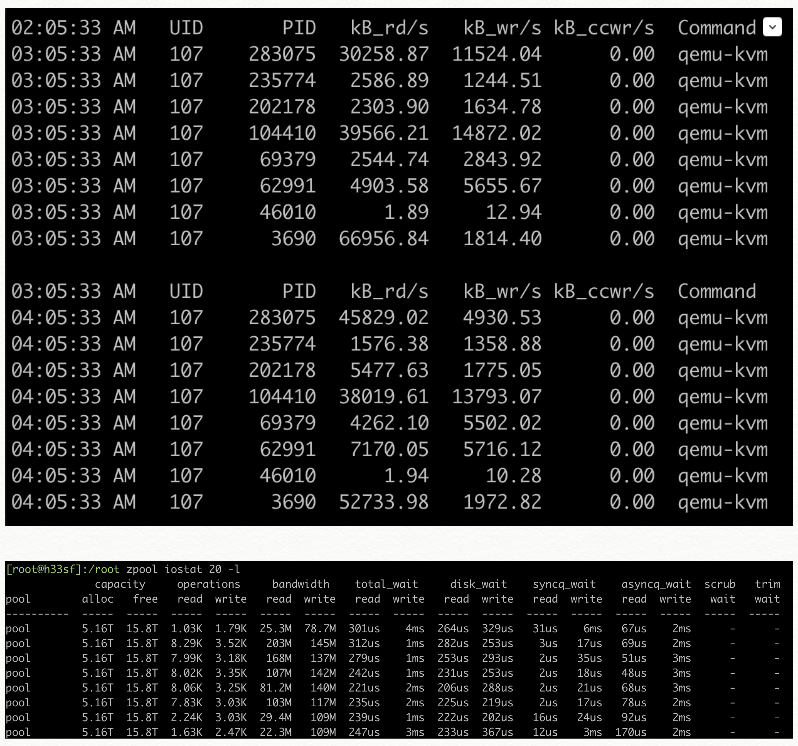
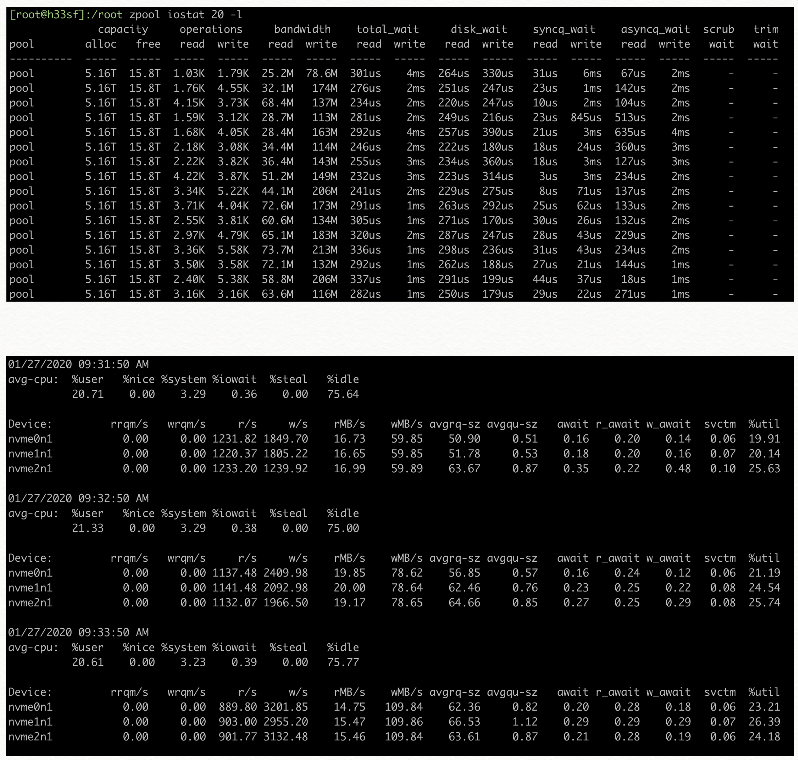
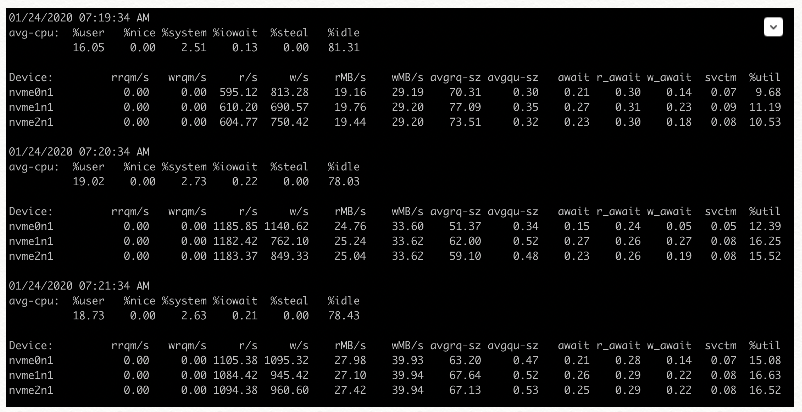
This is a server using 3x 7.68TB NVMe’s in RAID 5, running a VM with about 1000 cPanel hosting accounts and over 200 small VPS’s.
The IOWAIT is below 1% and it is moving from 2k to 11k IOPS smoothly.
Over time, we also found it necessary to migrate a VM from one HV to another.
The KVM/QEMU setup offers live migration, which works well.
Migrating from one HV to another happens with just a few commands and at a speed of 400MB/s to 600MB/s in RAID 5/6 setup using PM983 Samsung SSD’s (using higher performance SSDs will increase the pool’s performance as well).
The average speed is about 1.8 TB’s per hour for a live migration.
So, it will take about eight hours for 14 TB’s of data to migrate to another HV.
In case of HV failure, all NVMe’s could be zoned to another HV and the data will be migrated within a few minutes (you will have to deal with a few minutes of downtime).
***
As you can see from the tests above, we have had a lot of time to test JBOF and see how it compares with the Ceph cluster solution we were using. And the JBOF setup was a better performer in every metric that mattered.
This is why we can wholeheartedly recommend similar solutions to all small and medium-sized companies, which are considering commercial SDS solutions like Ceph for their critical storage needs.
If you go with a commercial SDS, you will have a great product, but the costs will be too high for small- and medium-sized companies to keep up with.
If distributed storage is not a “MUST HAVE” option, going with JBOF is a great way for businesses to cut costs on storage, have redundancy (similar to distributed storage), enjoy the performance of ultra-expensive storage solutions without needing to invest in management expertise and, most importantly, provide an excellent and fast service to their customers, thus avoiding any issues arising of network latency, disaster possibilities, and so on.
No matter which of the alternative, low-cost options reviewed above you choose, the fully redundant one RAID 1, or the more budget one with 1x JBOF and up to eight hosts, you will take advantage of a next-level JBOD setup for NVMe flash drives at a reasonable price.
So, what you get is a true JBOF solution, not a plain NVMe server!
Originally published Monday, May 17th, 2021 at 12:26 pm, updated May 17, 2021 and is filed under Web Hosting Platform.