
Performance monitoring is now possible with the PHP Website Profiler in the Hepsia Control Panel

If a website appears to be loading slowly, there could be several reasons behind it, such as the speed of the internet connection, the server on which the website is hosted, or the underlying code of the website itself.
While some factors may be beyond your control, there are others that you can influence.
Starting this week, users now have the ability to run a quick analysis of the PHP code on their websites.
This analysis will allow them to determine how efficiently the code is running, identify elements that load faster or slower than others, and much more.
All it takes is a single click, thanks to our newly integrated PHP Website Profiler tool, accessible through the Hepsia Control Panel.
What is the PHP Website Profiler about?
PHP stands as one of the most widely used programming languages across the globe.
A staggering 80% of websites depend on PHP to some extent, solidifying its status as a favored language among programmers and web developers.
Despite its reputation for being user-friendly, programmers often rely on a range of tools to enhance their development efforts.
Within PHP’s extensive ecosystem, numerous tools are available, with the PHP profiler – a performance monitoring tool, being regarded as the most valuable among them.
PHP profilers provide developers with a precise assessment of their website’s performance.
They identify errors on a function-by-function and query-by-query basis, offering a comprehensive overview of the health of a website or application.
These profilers capture essential metrics such as time spent per line of code, and frequency of method calls.
Furthermore, they assist in identifying inefficiencies and areas that could be improved throughout the entire web stack. In any PHP project, these tools are an indispensable component.
How does the PHP Website Profiler work?
The PHP Website Profiler, integrated into the Hepsia Control Panel, brings together the key features of online performance monitoring tools.
This profiler is capable of loading a website or application directly from the web server and analyzing its performance at the code level.
By eliminating variables such as connection speed and network performance, it focuses solely on objective site performance.
Once the profiler finishes loading your website, it generates a comprehensive report highlighting the elements that took the longest to load.
You have the flexibility to run this tool on any page of your website, as long as it is developed using PHP.
NOTE: Users will not be able to generate a report when running this tool on non-PHP pages.
How to use Hepsia’s PHP Website Profiler?
Using the PHP Website Profiler for website performance monitoring is quite simple.
There are two ways users can access the tool within the Control Panel.
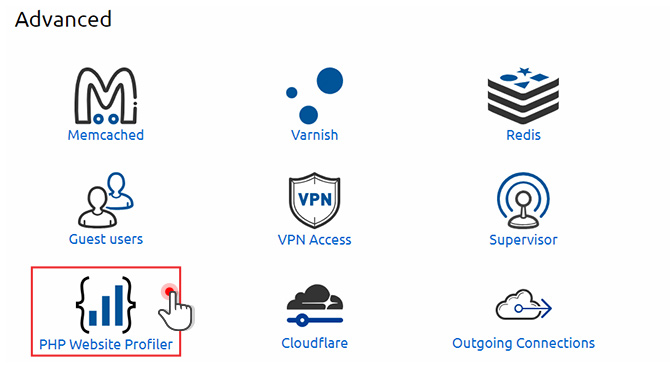
The first option is to click on the PHP Website Profiler icon in the Advanced section on the index page:
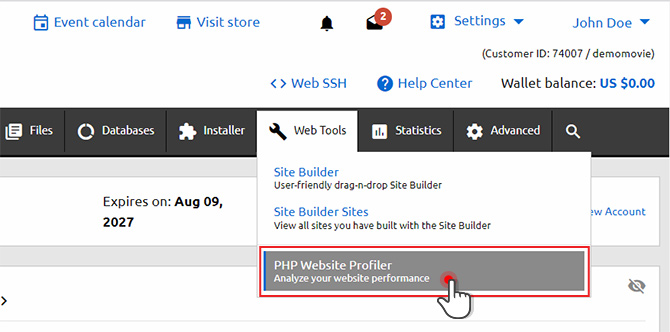
Alternatively, users can click on the PHP Website Profiler link found in the Web Tools menu:
To initiate profiling for a specific host, a user should simply locate the desired host in the section and click on the performance measurement icon located in the Actions column:
In the pop-up window, a user should select the protocol they want to use from the Protocol field.
If needed, users can indicate the specific folder that should be monitored by the profiler in the URL section.
However, if a user wants to conduct profiling for the main folder, they should leave the URL field unchanged.
The final step is to click on the Start button to initiate website profiling;
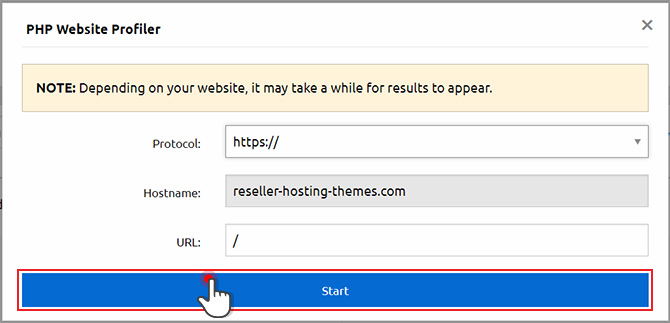
Depending on the size and complexity of a website, it may take some time for the results to appear.
On the results page, a comprehensive graph overview of the most frequently used PHP functions on a given website will be displayed:
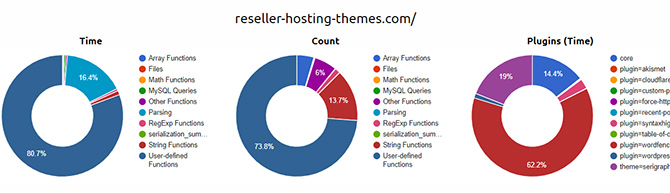
The first graph (Time) showcases which element of the whole PHP process takes the longest to execute.
The second graph (Count) displays how many operations are in each PHP process category and what percentage of the total they make up.
Additionally, the execution time of any installed plugins is displayed.
Below the graph area is a detailed list of all PHP functions that are executed while your website is being loaded:
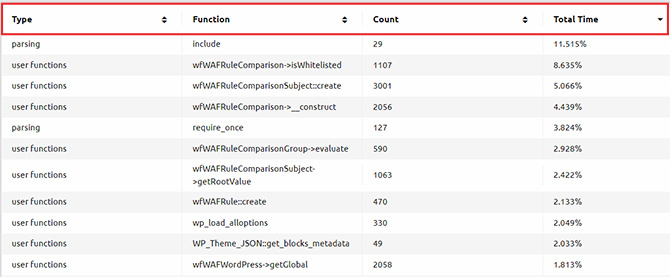
Here is what all columns in the table are about:
- Type – the type of PHP data that is monitored; this includes array functions, math functions, files, My SQL queries, parsing, etc.;
- Function – the specific function type that is monitored by the tool (e.g. include, query, get_opiton, translate, etc.);
- Count – the number of functions executed per type;
- Total time (in percent) – how much time it took to execute the function, compared to the total load time.
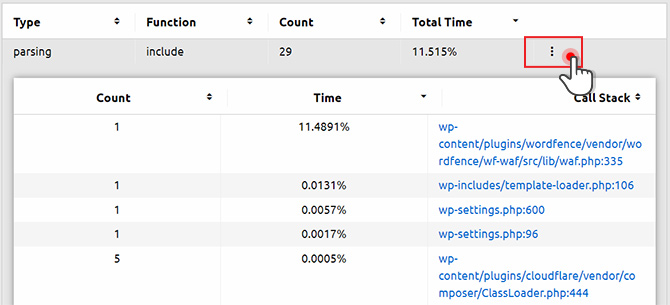
For more in-depth analysis, a user should click on the “dots” icon on the right of the listed functions. This will reveal a breakdown of all related functions:
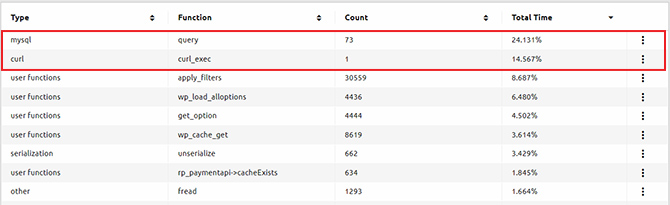
Let’s examine a particular user scenario in which the PHP profiling process has produced the following results:

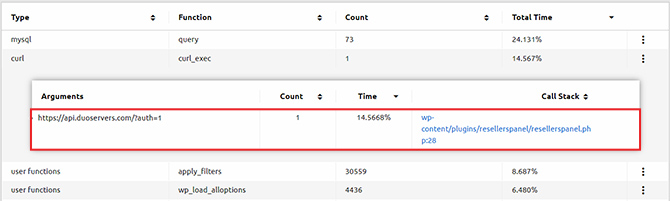
Upon analysis, it is apparent that the most time-consuming aspects of the profiled website are the MySQL queries and the cURL function:
By selecting the “dots” icon for the MySQL outcome, the website owner can promptly identify the precise query that takes up most of the execution time:
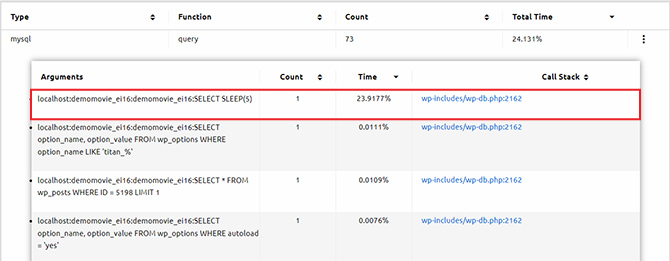
Similarly, by clicking on the “dots” for the cURL function, the user will discover that a particular external API query requires excessive time to execute, leading to an overall decrease in performance:
***
By providing a fast and effortless method to examine the efficiency of their code, the PHP Website Profiler offers users valuable real-time insights into any potential problems and helps maintain the health of their websites.
Adding this feature will enhance your customers’ experience with the Hepsia Control Panel, making it a great selling point for your business.

Leave a Reply