
Hepsia’s Statistics widget now presents data in a more informative way

Updates have been made to the Statistics widget of the Hepsia Control Panel to improve the manner in which traffic data is presented.
With today’s update, users will have access to a new statistics tab that shows 48-hour traffic data for their websites.
A visual update has been made to the ‘Visitors’ area as well. Each IP address now includes a country flag, enabling users to quickly identify the countries from which their visitors originate.
What is the new “48h” statistics tab about?
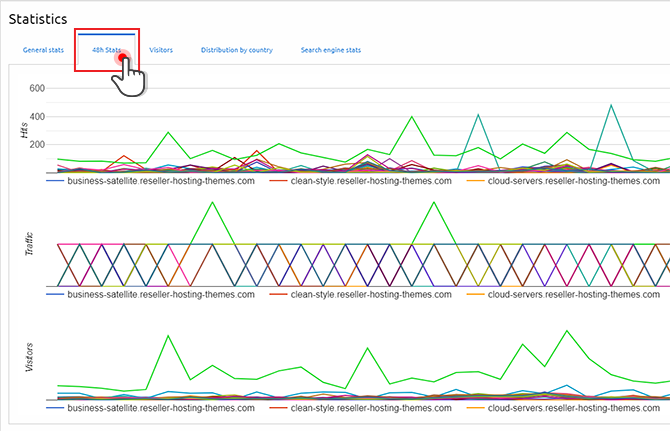
The new “48h” tab is located right next to the General statistics tab of the Statistics widget on the index page of the Hepsia Control Panel.
It represents a concise overview of the most important server traffic usage indicators over a 48-hour span, including visitor count, generated traffic, and hits for a period of 48 hours.
This information is displayed via three distinct graphs and includes all hosts associated with a hosting account.
To facilitate easy identification, each host is represented by a unique color within the graphs:
To view the statistics of a particular host (if multiple hosts are available), a user simply needs to click on the name of that specific host located below the graph.
Here is an overview of the various traffic parameters presented in the tab:
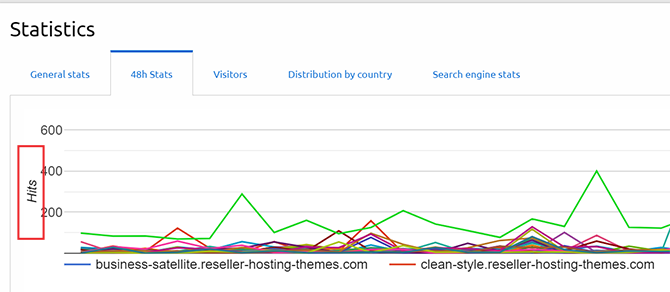
Hits
Each request sent to the hosting server is counted as a hit. This could include images, graphics, etc.
A typical web page consists of multiple images (each considered a file and therefore a hit) and numerous buttons (also files and hits).
So, if a home page contains three images, a style sheet like style.css, and the actual page itself (let’s say index.html), then each time a browser requests that page from our server, four hits are recorded. On average, each page will have around 15 hits.
Traffic
Traffic refers to the amount of data in MB that has been sent by the server during any given hour within the 48-hour timeframe.
Each file has its own size depending on how much information it contains.
For example, if a webpage is 30 KB and includes three images that are each 50 KB in size, every time this webpage is displayed, it will increase total traffic by an additional 180 KB.
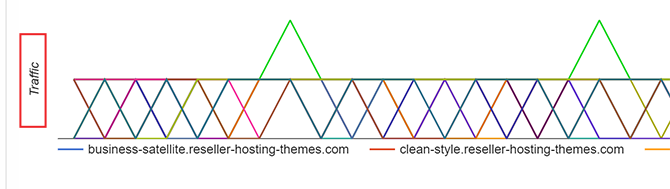
By analyzing both hits and traffic statistics, users can gain valuable insights into the overall server usage, helping them understand what server resources their websites consume.
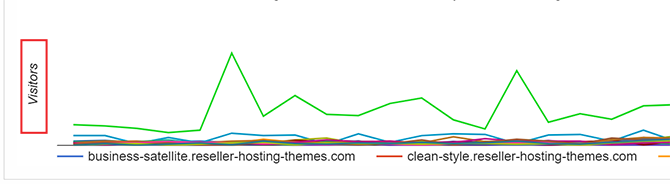
Visitors
When the server receives a request from an IP address, this tool calculates the duration since the last visit by that same IP. Essentially, each visit represents one unique visitor who comes to a website and explores its content.
Regardless of how frequently the same visitor has been to your site, every visit is counted towards the total number of visitors.
IP addresses now indicate the country of origin
In addition to introducing the 48h tab, we have also made improvements to the Visitors section of the Statistics widget.
A country flag now appears next to each IP address, so users can quickly identify the countries from which their visitors come.
***
With the new updates to the Statistics widget, users will be able to digest traffic data more easily.
Our ongoing efforts are focused on continuously improving the Hepsia Control Panel to provide a richer set of features and enhance user-friendliness. Stay connected for upcoming valuable updates in this regard.

Tags: Hepsia control panel
Leave a Reply