
Highlights from the latest domain industry report and the TLD trends on our platform
Earlier this month, Verisign – the global leader in domain name and Internet security services, released its latest domain name industry report, which offers an up-to-date insight into the global TLD market trends.
The report covers the second quarter of 2018 and gives valuable information about the TLD performance dynamics on the domain market.
Check out the main domain name industry highlights from the report and see which TLDs perform best on our platform as well.
What is the domain industry report about?
The latest industry report from Verisign shows that the first half of 2018 closed with about 339.8 million domain name registrations across all TLD extensions worldwide.
This figure marks a 2% increase of domain registrations compared to the first quarter of 2018, which means that approximately 6 million more domain names were registered over a period of just 3 months!
Indeed, this is a remarkable figure, bearing in mind that the number of domain registrations in the previous quarter period grew by only 1.4 million (0.4%) as compared to the fourth quarter of 2017.
In comparison to the figures from a year ago, domain name registrations mark a 2.4% spike, which translates into an increase by almost 8 million domain names.
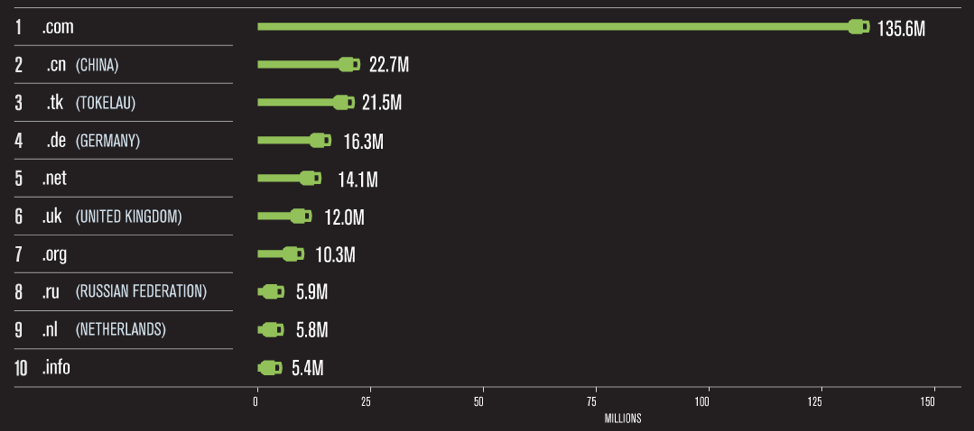
In their latest report, Verisign presents a breakdown of the domain registrations by TLD, which gives a good idea of the most popular TLDs on the market:
gTLDs
As of June 30, 2018, the most popular gTLDs on the market are .COM, .NET, .ORG and .INFO as their base (a total of 165.4 million) represents 49% of all registrations worldwide.
.COM keeps being the front runner with the impressive 135.8 million registrations, which have grown by 5% since June 2017.
The other three gTLDs show a drop in registrations compared to last year, with .NET reaching a 7% decrease in numbers.
ccTLDs
The total number of country-code (ccTLD) domain name registrations amounts to 149.7 million, which represents around 44% of all TLD registrations, as of June 30 2018.
This is an increase of approximately 5.5 million domain name registrations, or 3.8 percent, compared to the second quarter of 2017.
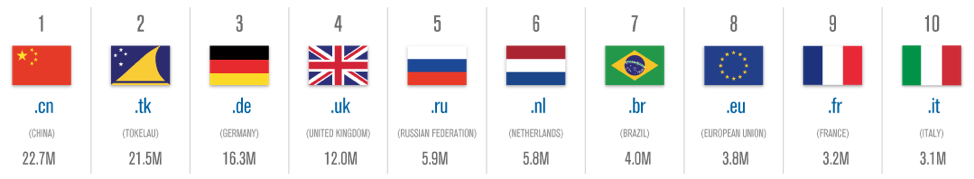
According to the Verisign’s report, the most popular ccTLD, as of June 30, 2018, is .CN with the stunning 22.7 million registrations, followed by .TK (a free ccTLD), .DE (Germany’s TLD), .UK (United Kingdom’s TLD) and .RU (Russia’s TLD).
The remainder of the Top 10 chart of ccTLDs is completed by the Netherlands’ .NL TLD, Brazil’s .BR TLD, the European Union’s .EU TLD, France’s .FR TLD and Italy’s .IT TLD.
nTLDs
The total reported amount of nTLDs at the end of the first half of 2018 was 21.8 million, a decrease of approximately 2.5 million domain name registrations, or 10.4 percent, compared to June 30, 2017.
According to the report, the most popular nTLDs are .TOP, .LOAN and .XYZ, followed by .CLUB and .ONLINE.
The report includes a chart, which shows that nTLD registrations represent 6.4% of all TLD registrations:
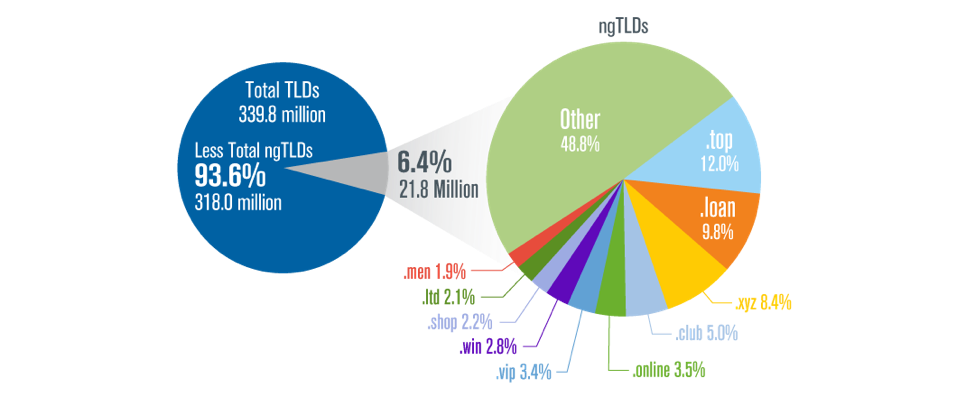
For more TLD stats, check out the latest issue of the Domain Name Industry Report.
What are the TLD trends on our platform?
Following up with the report of Verisign, we’ve made our own research into the TLD trends across our platform.
As of June 30, 2018, we’ve observed a 5% increase in the number of domain registrations compared to the volumes from a year ago.
gTLDs and ccTLDs have preserved steady increase rates year over year.
In contrast to the global nTLD trend, however, we’ve seen an increase in the number of new generic TLD registrations as well.
This is largely due to the increased number of nTLDs on our platform and also the various promo campaigns we’ve been running for some of the most attractive ones.
And of course, thanks to your continued marketing and promotional efforts via your own stores and brands.
In the chart below, you can see the distribution of domain registrations in regards to TLD types as of June 30, 2018:
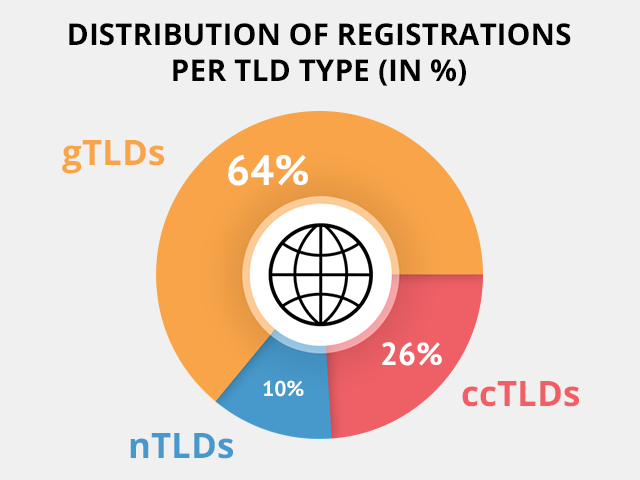
gTLDs still have a dominating presence in the chart and will most probably continue to do so for a long time in tune with the global trend.
It seems that regardless of the growing significance of the local factor (ccTLDs) and the increasing popularity of keywordish domains (nTLDs), .COM, .NET and .ORG will continue to be a top choice for the majority of new registrations across our platform and the market in general for years to come.
The chart listed below lists the most popular TLDs across our platform:
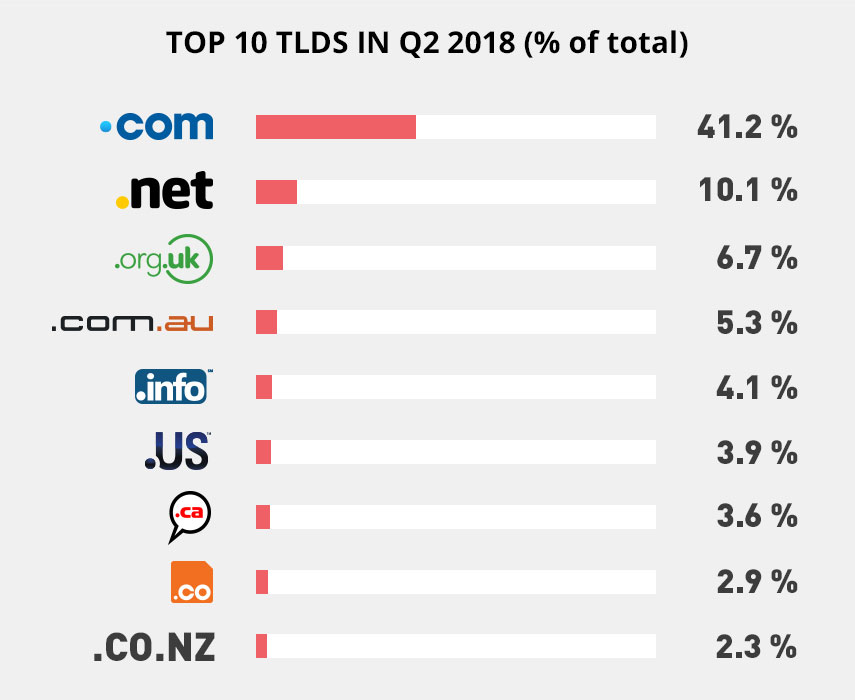
As in the Verisign report, the top 10 chart on our platform features the most popular gTLDs – .COM, .NET, .ORG and .INFO.
As for ccTLDs, the chart is a reflection of the markets where the majority of our partners operate in, namely the United Kingdom, Australia, the United States, Canada and New Zealand.
It’s interesting to note that .CO – albeit a ccTLD, has entered into our top 10 chart thanks to its growing popularity as an alternative to .COM.
***
Even with all of the new domain extensions, catchy .COM alternatives and a variety of country-specific TLDs on the market today, .COM remains on top when it comes to domain industry trends.
Although .COM isn’t always the top choice for startups and small businesses today, it is still an important decision-taking factor. So it will likely remain on top thanks to it its universal recognition and long-standing history online.
Nevertheless, we keep focusing on new TLDs, aiming for a greater variety and better prices.
Stay tuned for more new nTLD introductions and price updates.
Originally published Friday, August 24th, 2018 at 3:23 pm, updated July 8, 2024 and is filed under Domain Names.Tags: nTLDs, ccTLDs, gTLDs, statistics, marketing
Leave a Reply